YaMarkets • 2025-08-19
Trading without looking back at your trades is one of the biggest mistakes a trader can make. Reviewing and analysing your performance is a fundamental step towards a successful trading career. But for that traders need a reliable reporting tool to measure their results, evaluate their strategies, and adjust exposure risk.
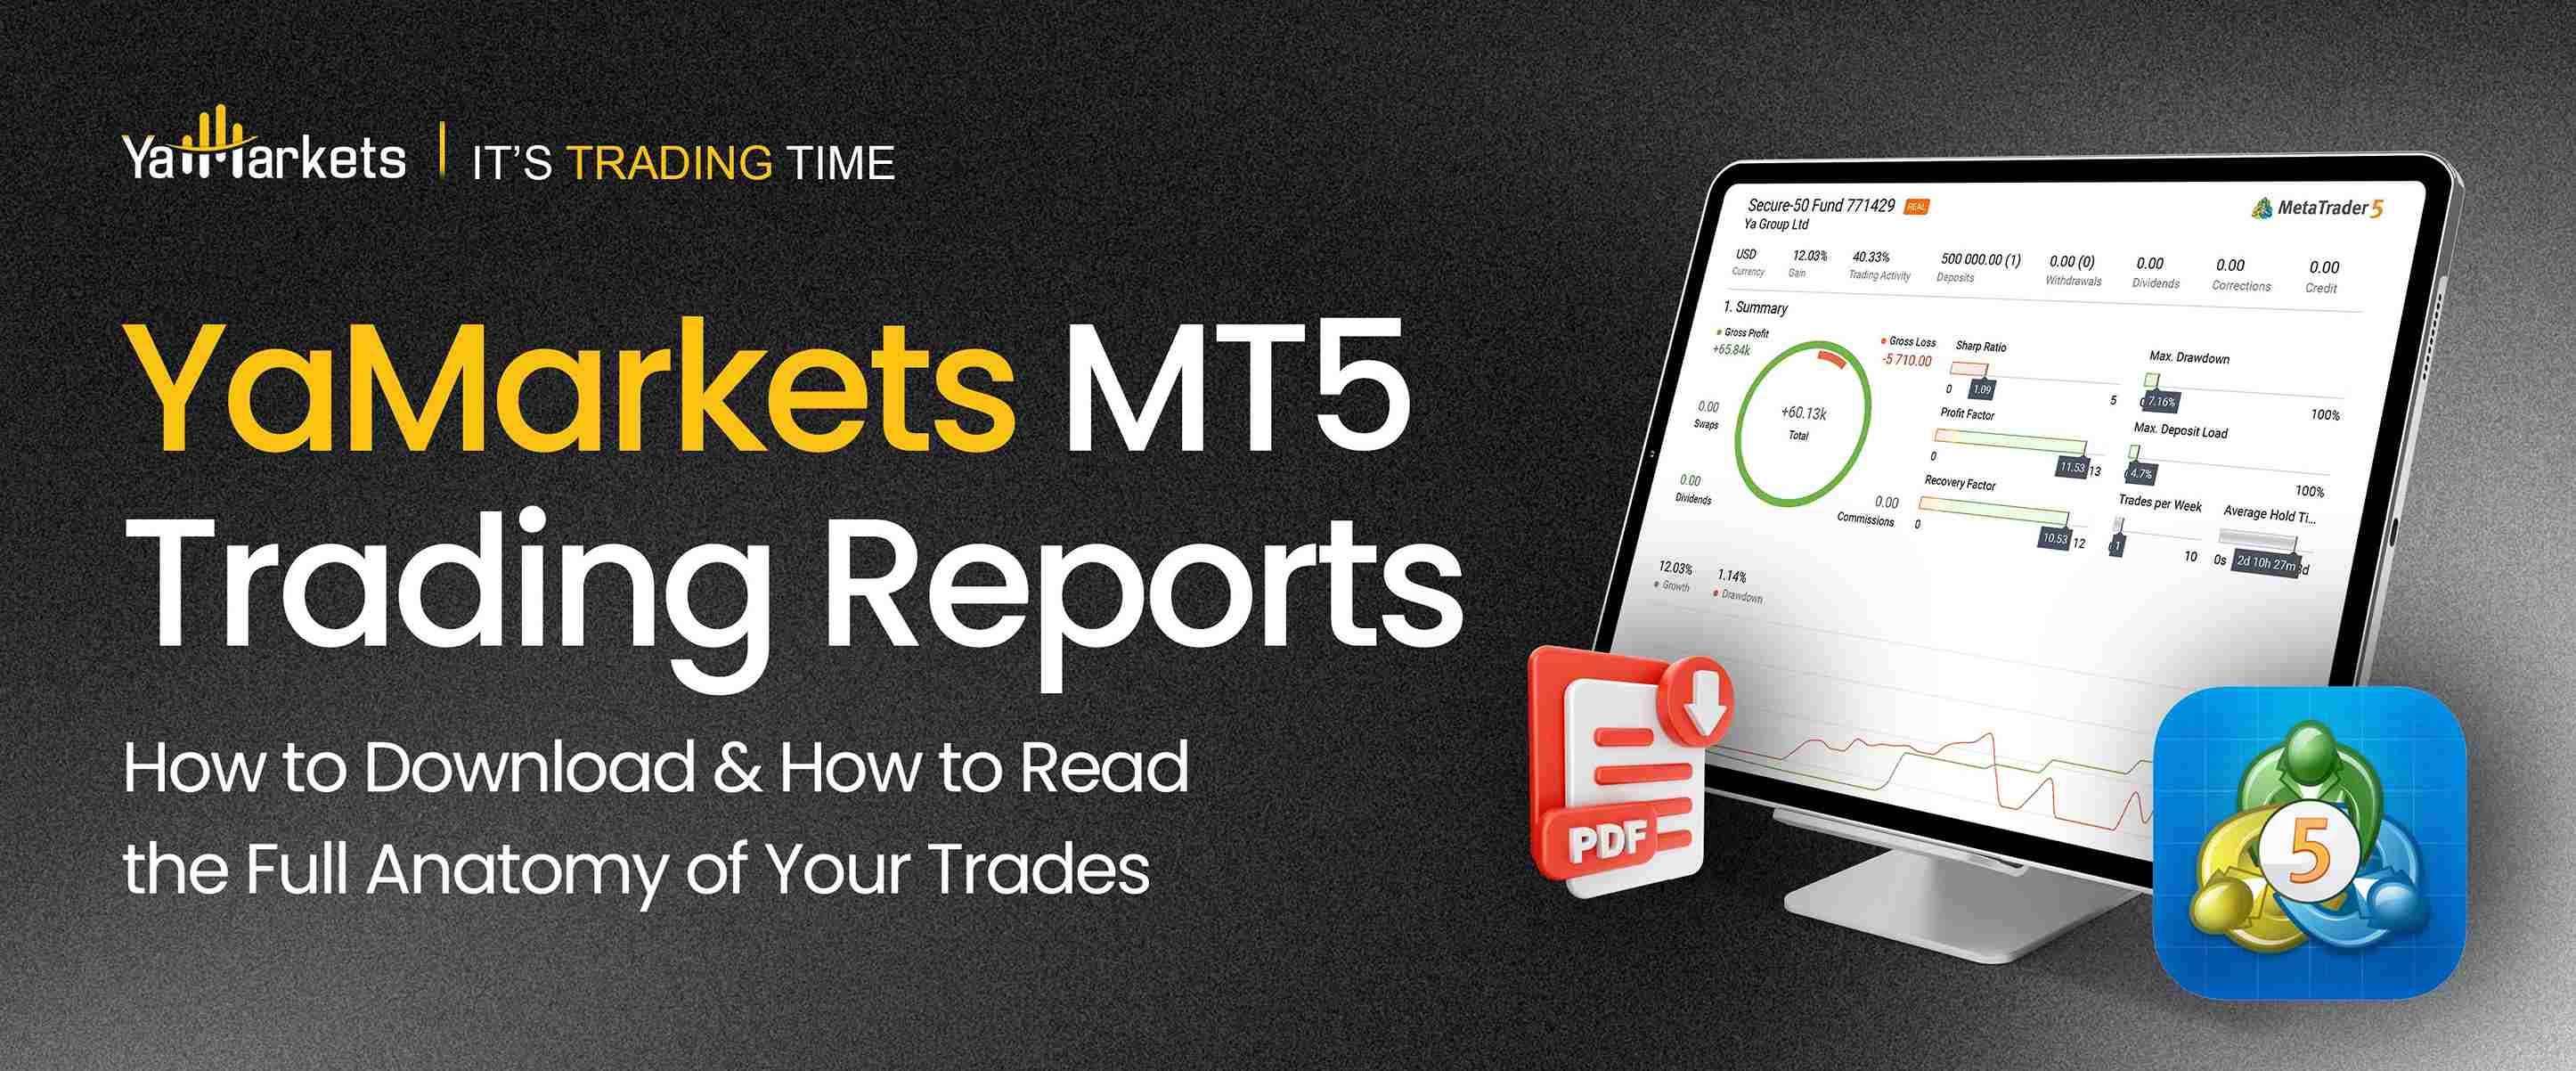
With YaMarkets through MetaTrader 5 you can generate a detailed trading report directly from the MT5 terminal. This report highlights both performance and stability, making it a critical tool for your trade analysis.
For a better understanding you can watch our tutorial here:
The report can be accessed directly from the MT5 platform. The process is identical for both demo and live accounts.
The downloaded file includes balance, equity, trade history, and statistical metrics that allow for deeper evaluation of trading efficiency.
Fig. 1 MT5 Trading Report Overview
Fig. 2 MT5 Trading Report PDF
A measure of returns adjusted for volatility
The Sharpe Ratio evaluates the relationship between risk and return. A value below zero signals unprofitability, while higher values indicate efficiency.
It shows whether the profit justifies the risks taken.
Ratio < 0 → Strategy is unprofitable.
Ratio ~ 1 → Risks are justified but not exceptional.
Ratio ≥ 3 → Strategy shows excellent efficiency.
The worst loss from the highest balance to a subsequent low.
This metric represents the largest balance decline from a peak. The YaMarkets MT5 report calculates it automatically.
High drawdowns mean higher capital risk.
≤ 20% → Conservative strategy.
20–30% → Acceptable but risky.
≥ 50% → High probability of account depletion.
The ratio of net profit to maximum drawdown.
The Recovery Factor measures how quickly a strategy can return from losses.
It indicates the ability of a system to compensate for losses.
< 1 → Weak recovery ability.
≥ 3 → Strong recovery potential.
≥ 5 → Highly sustainable strategy.
The ratio of gross profit to gross loss.
The Profit Factor compares total gains against total losses.
It shows the long-term profitability of a strategy.
≤ 1 → Unprofitable system.
1–1.5 → Weak but possibly usable.
≥ 2 → Stable profitability.
Maximum margin usage during trading.
Deposit load measures the percentage of capital tied to open positions.
Higher loads increase the risk of margin calls and stop-outs.
≤ 20% → Low exposure, safer.
20–50% → Moderate risk.
≥ 50% → Aggressive trading, higher liquidation risk.
The MT5 trading report provides objective metrics that cannot be derived from trade history alone. By combining Sharpe Ratio, drawdown, recovery, profit factor, and deposit load, traders gain a structured view of both profitability and risk. Each metric works best when analyzed in relation to the others rather than in isolation.
With YaMarkets MT5, traders can generate detailed reports at any time. These reports provide a standardized framework for measuring strategies, adjusting exposure, and improving execution. Proper use of these analytics can reduce uncertainty and support long-term stability.
For ultra-fast trading experience and easy withdrawal system - Open Your Live Account with YaMarkets Now!

 AI
AI


.jpg)
.jpg)
.jpg)
2.jpg)

1.jpg)
.jpg)